Access the Dashboard by selecting Dashboard from the Utilities Menu.
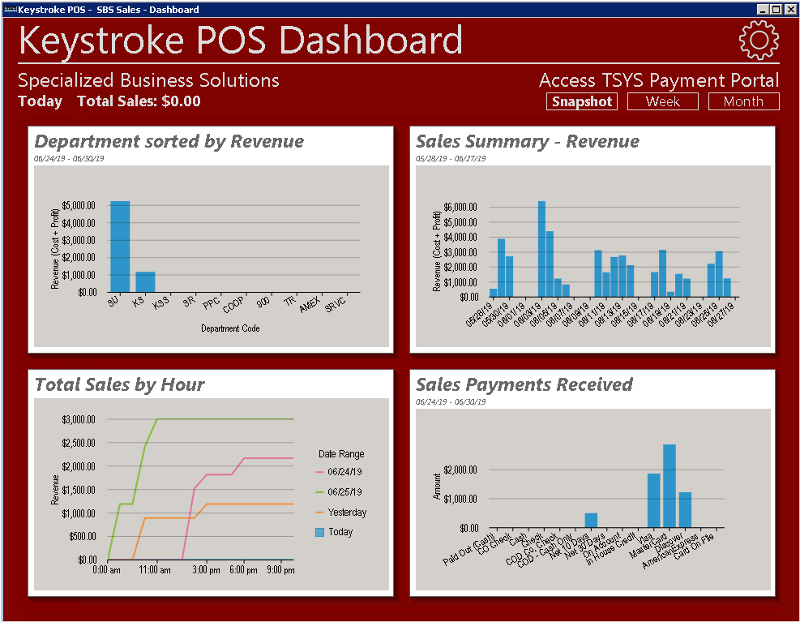
The Dashboard is most meaningful when used with live business data (as opposed to with the Keystroke Sample Data). Dashboard may be left running on, for example, a manager's desktop as a way to quickly review business activity in a graphical form without having to run reports. The data displayed by the Dashboard may be refreshed anytime by clicking a View button (Snapshot, Week, Month).
Install the Dashboard in the same folder as the main Keystroke installation. Run it either from the Utilities Menu in Keystroke or using a shortcut to run Dashboard.exe (with the same Startup Switches used to start Keystroke).
Notes and Tips:
- An active Software Maintenance plan is required to run the Dashboard.
- Dashboard requires at least Keystroke Version 8.00.73.
- Use the /R (register number) switch if running dashboard on multiple registers.
- Each View offers unique Tiles and a different default date range.
- Click on the Snapshot, Week, or Month buttons to change or refresh the current View.
- Left-click to enlarge and stretch an individual Tile.
- Right-Click on a Tile to change parameters (temporary settings) for the current View without affecting the Saved Settings.
- Click the gear icon in the upper right corner to change Saved Settings for the current View (Saved Settings are stored in DashboardSettings.DAT).
Additional Tile Templates for the "Inventory Sales by Department" tile are available. These templates produce the same graphs as "Department Sales" but the department (or category/location) is based on the current setting on the inventory database record instead of on the department/category/location code saved with the line item at the time it was sold. The new graphs are slightly slower than the default department graphs due to the time it takes to look up each inventory item.
See:
Utilities Menu